

Market research data holds immense potential to provide valuable insights that can drive informed business decisions. However, the real value lies in effectively analysing the data to extract meaningful and actionable insights. The process of analysing and deriving insights from this data can be complex and challenging.
In this article, we will outline a step-by-step process to effectively analyse market research data and uncover valuable insights.
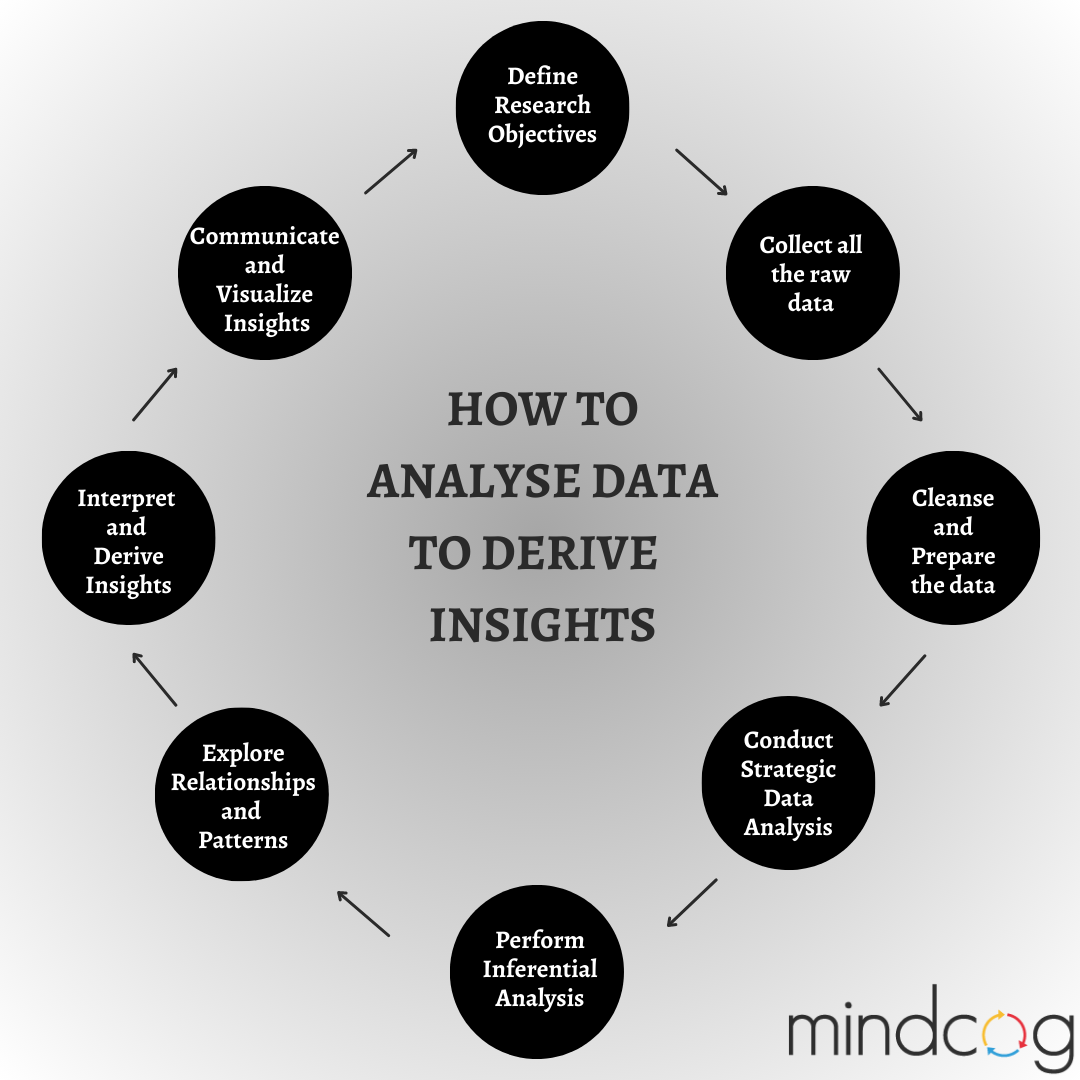
- Define Research Objectives: Begin by clearly defining your research objectives. Identify the specific questions you want to ask or the problems you want to solve through the analysis. This will guide your data analysis process and help you focus on relevant variables and metrics.
- Collect all the raw data: Information comes in all forms, formats, and sources. It can be structured, unstructured, or semi-structured. The first step is to compile all the relevant data that you have such as data from ad platforms, CRM, marketing automation, email, social media, scientific data and web analytics.
- Cleanse and Prepare the data: Before diving into analysis, it is crucial to clean and prepare the data.
Remove any
-
- Outliers
- missing values
- inconsistencies
that could skew your results.
In market research, the quality of the underlying data determines the value of the analysis. High-quality data needs to be valid, accurate, complete, consistent, and uniform.
To find and rectify any inconsistencies, missing values and outliers you should once manually scourge through all the data values. This step requires a lot of time and effort to ensure it is completely clean for the actual analysis phase. Organize the data in a structured format and ensure it is ready for analysis.
An essential part of this step is deciding the technology for
-
- data gathering
- processing
- storing
Data and insights must be accessible at any time, especially those critical for business. Selecting where to store your data depends on a combination of factors including volume, speed, reliability, and maintenance. But your data warehouse and architecture should be managed and scalable to meet your ever changing business needs.
- Conduct strategic data analysis: After cleaning the data, it’s now time to uncover patterns using statistical models and visualizations. Choose the appropriate analytical techniques based on your research objectives and the type of data you have. Common techniques include correlation analysis, regression analysis, analysis, and data visualisation. Each technique offers unique insights into different aspects of the data: data categories, segments. You can Start by conducting descriptive analysis to summarise and explore the key characteristics of your data. Calculate measures such as: mean, median, mode, standard deviation, and percentages to understand the central tendencies, variations, and distributions within the data.
Data visualization techniques like charts and graphs can help in presenting the findings effectively.
- Perform Inferential Analysis: Move on to inferential analysis, which involves drawing conclusions and making predictions based on the sample data. Apply statistical techniques such as hypothesis testing, t-tests, ANOVA, or chi-square tests to analyse relationships between variables and make inferences about the target population.
- Explore Relationships and Patterns: Dig deeper into the data to identify relationships and patterns that can provide valuable insights. Conduct correlation analysis to understand the strength and direction of relationships between variables. Utilise regression analysis to uncover factors influencing key outcomes. After analysing your data through multiple models, you should evaluate the performance and see which predictions match the observed data. This way, you’ll know which technique produces the most accurate results.
- Interpret and Derive Insights: Interpret the findings of the analysis and draw important conclusions from the information. Search for trends, patterns, or important discoveries that can help you uncover the answers to your research questions or solve practical problems. Using the data analysis’s findings as a guide, make connections between various factors and come to practical conclusions.
- Communicate and Visualise Insights: The final step is to effectively communicate your insights by presenting them in a clear and compelling manner. Utilise data visualisation techniques such as charts, graphs, forecasting models and infographics to make the findings more accessible and understandable to a wider audience. Craft a concise and engaging narrative that highlights the key insights and their implications for decision-making.
Analysing market research data is a crucial step in unlocking valuable insights that can drive strategic decision-making. By following these steps, businesses can make sense of their data, uncover meaningful patterns, and derive actionable insights that can fuel growth and success. Remember, data analysis is not a one-time activity, but an iterative process that requires continuous evaluation and adaptation to stay ahead in today’s dynamic business landscape.